Tuesday, 26 November 2019

Hyperkalaemia as an example of how clinician behaviour can be inferred from laboratory data


Hyperkalaemia as an example of how clinician behaviour can be inferred from laboratory data


Abnormal results and repeat testing

There are three reasons that a potassium test might be high.

1.     It may be the tail of a “normal” population
2.     It may be an artefact
3.     It may come from a patient with a pathological reason for a high potassium

The first response to raised potassium is generally to repeat, as this helps distinguish results that are spuriously high. The urgency with which a test is repeated may depend on the level of the result, or on some other patient factors. Alternatively, clinicians may choose to live with the uncertainty of a result, and assume it is spuriously raised, or raised in a way that is not clinically important.

We have looked to see if tests done in primary care are repeated within 48 hours, and where this happens (Figure 2)

Figure 2 Location and frequency of repeat primary care potassium tests, according to initial result.

We can see that tests are slightly more likely to be repeated when potassium results rise above the reference range (>5.3), but that repeats are much more likely to occur when the result is 6.0 or above. This aligns with the level at which the laboratory telephones results. About 80% of these repeats are carried out in primary care. However, when the initial potassium result rises to 6.5 or higher, then the rate of retesting in the ED rises to over 50%.

Conclusion

This data supports the idea that we can think of high potassium results falling into three different categories, based on the resulting actions (Table 1).

Result category
Band
Clinician behaviour
Low high
5.4-5.9
May ignore, or repeat at a later date
Moderate high
6.0-6.4
More likely to repeat urgently
High high
>6.4
Very likely to repeat urgently, and more likely to admit to hospital

Table 1 Impact of potassium result in primary care on clinician behaviour

Figure 3 shows how these categories map onto the distribution of potassium results in primary care.

Figure 3 Distribution of potassium results in primary care 2012-2018


The clinical importance of variation in analyte mean values


The clinical importance of variation in analyte mean values


In a previous blog we have discussed the variation in potassium results received from primary care across the year. This is mainly due to poor specimen stabilisation in low temperatures.

We have extended our analysis to compare primary care results with those taken in the Emergency Department (ED). Figure 1 shows this comparison.


Figure 1 Graph of mean monthly potassium in North Devon ED and all GP practices (winter months in pink)

In this figure we can see a few important things :


  • The monthly mean of potassium in the ED is stable.
  • In March 2018 the laboratory switched its analyser provider. This was associated with a clear shift in the mean monthly potassium result.
  • The median result of the individual GP practice means shows variation throughout the year
  • There appears to be a systematic difference between the ED and GP results.


  • In this series of blogs we will look at some of these issues in more detail.

    Saturday, 6 July 2019

    On collaborative management of recurrent UTI

    In a population of about 160000 people in N Devon, about 400 people with 3 or more MSUs sent in on year. About 200 people on repeat trimethoprim or nitrofurantoin.

    Since 2016 we have been running a joint microbiology / urology clinic for recurrent UTI. This is a summary of what we do, and the what it's done for first 36 patients. Main conclusions are :


    • This is a group of patients who have been poorly served with high morbidity
    • Bearing witness to the impact on their lives is the first step in developing a therapeutic alliance
    • Attention to basics is important. This includes drinking plenty. It does not include advice on how to wipe.
    • Self start strategies with patient defined course length works well for most people
    • There are a few really complex patients who need ongoing support and this includes a different approach by the laboratory to do this - eg. next day sensitivities; interpreting mixtures in a way that is helpful; working up low numbers of "non pathogenic" organisms; looking for "atypical" organisms

    This is what has happened :
    • 24 patients with self start
      • 18 better (less than 3 MSUs in year after clinic)
      • 13 with follow up data from primary care
    • 11 patients with prolonged high dose abx
      • 4 better
      • 9 with follow up data from primary care
    • 1 patient continued prophylaxis
      • 1 better
      • 1 with follow up data from primary care
    11 admissions in year before clinic appt; 1 admission in year after clinic

    In patients with primary care data :
    • 1978 DDDs of abx in year before clinic appt; 586 DDs in year after
    • 324 consultations in year before; 169 in year after
    • 187 UTI consultations in year before; 51 in year after

    E coli most predominant pathogen
    Some probable genuine mixtures
    Some poorly defined
    Some with no positive specimens

    Although most patients have pyuria in specimens in the year before clinic, this is not universal, and may not be consistent over time

    Complex anatomy main reason for failure. eg. cystoplasty; vaginal tapes; trauma
    Some patients appear to have problems with prostate but not clearly defined - no abscesses
    Underlying conditions may be an issue - particularly if immunosuppressed / steroids

    Patient engagement with early self start may be an issue

    About 50% of patients who fail lost to follow up
    Significant number with complex micro work closely with lab results to define each infection and optimise Rx using early self start

    One patient with RA appears to have had no problems since RA under control

    Prescribing data on 3 of 5 complex patients working with lab on early self start shows reduction in abx usage from 287 DDDs to 67 DDDs.

    What we do


    Effect on life

    • How often between episodes?
    • Is start of episode clear? What are main symptoms?
    • Completely  well or not between episodes?
    • Nocturia often useful as a gauge of impact
    • Flow symptoms
    • In men – prostatitis and orchitis symptoms
    Microbiology
    • Proven with positive MSUs?
    • Same organism?
      • If same organism then more likely to consider prolonged high dose combination eradication
    • E coli?
      • D mannose may be effective
    • Proteus?
      • May be particularly important to maintain acidic pH and look for stones
    If MSUs are negative :
    • is there pyuria?
    • Have fastidious organisms or non-typical organisms been looked for?
    • Is this non-infective? Eg. interstitial cystitis.
    Note that not all patients have pyuria, although an absence of pyuria makes diagnosis of infection more questionable.

    If repeated mixed cultures, or other diagnostic uncertainty, then get higher quality specimen
    • Peezy
    • In out catheter
     Other laboratory tests

    Inflammatory markers are not generally helpful and we don’t measure

    Creatinine
    • Evidence of pyelonephritis (Flank pain / rigors)
    • may push away from nitrofurantoin
    • may push towards more interventional approach
    Anatomical problems

    All patients need USS to assess for clear structural abnormalities and residual volume

    If significant residual volume then this needs managing.

    Most patients probably need cystoscopy at some point, although low pick up, and may be able to avoid if normal USS and no visible or non-visible haematuria between episodes.

    Stents and stones are hard to manage – will be colonised.

    Pneumaturia requires urgent investigation

    Catheters

    Is patient catheterised or intermittent catheterisation?
    Why?
    Things to try :
         Review technique especially if ISC.
    Consider prophylactic abx at change and change frequency      
    Washouts
         Intravesicular gentamicin
         Maintenance of mildly acidic pH
         Coated catheters

    Precipitating factors

    Sex
    • Post coital voiding
    • Post coital prophylaxis (guided by previous cultures; nitrofurantoin as default)
    Periods
    • Consider prophylaxis at this time
    • Possibly explore options for suppressing menstrual cycle
    Anything else (eg. dehydration, especially if fear of drinking before going out or at night)
    Encourage to drink at least 2 litres of water per day – Fill 2 jugs with water in morning)

    Aggravating factors that may need addressing

    Constipation
    Diabetes
    Iron overload states
    Steroids

    General approaches to management

    Tell patients to drink plenty. At least 2 litres per day. Fill jugs in morning and make sure finished by evening.

    In post menopausal women, topical oestrogens should be tried for at least 6/12

    Double voiding

    Post-coital voiding

    Explore alternative antibiotic management options, with a view to stopping prophylaxis, and/or reducing regular visits. Options include :
    • Prescribe standby antibiotics and provide patients with redtop tube to submit MSU if symptomatic; and then immediately start a course of antibiotics (based on previous sensitivities – discuss with micro if complex) and continue until the day after symptoms have resolved.
    • If related to sexual activity, consider post-coital prophylaxis.
    • Prescribe a prolonged treatment course (at least 3/12) of two antibiotics based on previous results. This option may be good if consistently same organism / antibiogram. Probably less good if not consistent. Options include
      • Cefalexin 500mg QDS
      • Nitrofurantoin 100mg MR BD
      • Trimethoprim 200mg BD
      • Azithromycin 500mg OD

    If breakthrough infections then continue baseline antibiotics and add new agents based on MSU results

    Consider hipuric acid for 6/12. Prolonged courses probably should be avoided due to theoretical risk of bladder cancer.

    If recurrent E coli consider D mannose (not if diabetic)

    Consider intravesicular gentamicin if limited oral options and self-catheterises

    Consider urinary pH monitoring both as a means of diagnosis and an aid to antibiotic optimisation (note particularly gentamicin favours high pH; nitrofurantoin lower pH).

    Consider dietary modification. Generally promote vegetarian diet. Consider things like high dose vitamin C.

    Ensure aggravating conditions managed appropriately, especially diabetes

    Consider bladder washouts with eg. SubyG if ISC.

    Consider cystistat (although rarely do this now)

    Monday, 17 June 2019

    Overdiagnosis and reference ranges ... again.

    Here are our reference ranges for adult patients for a number of common analytes

    Low High
    Na 133 146
    K 3.5 5.3
    ALP 30 130
    BIL 0 21
    ALT 0 33
    ALB 35 50
    Prot 60 80
    Visc 1.5 1.72
    CRP 0 5
    TSH 0.27 4.2
    Hb 115 160
    WBC 4 11
    Plt 150 400

    Looking at an adult primary population, the percentage of specimens with results outside these ranges are :

    Low High
    Na 3.2% 0.5%
    K 1.2% 3.4%
    ALP 0.3% 8.0%
    BIL 0.0% 3.5%
    ALT 0.0% 13.3%
    ALB 2.0% 2.4%
    Prot 1.3% 2.1%
    Visc 1.7% 31.0%
    CRP 34.0%
    TSH 5.0% 13.0%
    Hb 10.0% 8.3%
    WBC 4.4% 5.6%
    Plt 6.9% 4.2%

    Now it is certainly true that this mixes up the pathogenic and the non-pathogenic. But it is surely also true that for most common tests that are carried out in primary care, most will be "normal". Or at least will be giving us very little diagnostic information. If a high proportion of the results are abnormal then the balance between sensitivity and specificity is almost certainly wrong. Do we really know the benefit of labelling a substantial proportion of a population abnormal? This appears to be a particular problem for tests we know are hard to interpret : ALT, ALP, TSH, inflammatory markers. With evidence that laboratory testing is helping drive an epidemic of overdiagnosis.

    These are what the reference limits would be if we were to make just 5% of population "abnormal"

    Low High
    Na 133 144
    K 3.7 5.3
    ALP 44 189
    BIL 0 23
    ALT 7 70
    ALB 36 49
    Prot 62 80
    Visc 1.51 1.99
    CRP 0 85
    TSH 0.08 8.89
    Hb 96 161
    WBC 3.69 13.1
    Plt 122 444

    Clinically this makes more sense. I have learned to ignore ALTs below 70. I don't worry about CRPs below 100. This is not to say that patients with an ALT below 70 don't have liver disease, or that a patient with a CRP below 85 doesn't have an inflammatory condition. This is why we still need clinical skills. It's just about thinking about when the test alone should prompt action - and this is how I think the reference range should be used.

    The haematology results here are interesting. The platelet and white cell cut-offs suggested do fit better with clinical feeling. Not sure if there is evidence on haemoglobin. Because this is what we really need - what is the predictive power of a test for specific pathologies?

    Creatinine shows a way forward here. The absolute clinical value of creatinine is low. But acute kidney injury flags based on relative changes feel clinically useful. 2.6% of renal function tests from primary care generate an AKI flag. This then might be a better way of thinking about normality. But unless we are very sure we know the benefit of reference ranges that medicalise large swathes of the population, I will continue to argue for wider limits.

    Friday, 14 June 2019

    ALT reference ranges

    ALT is a frequently performed blood test, and is a marker of liver cell damage.  However, many patients with liver damage have a normal ALT. So what is a logical approach to setting cut-offs for ALT? And let's get real - we know (because we've studied it) that most clinicians see reference ranges as normal ranges, and so hence results outside reference ranges are seen as abnormal.

    As a clinician, given that we know that a "normal" ALT does not rule out liver disease, what we probably want to know is "what level of ALT is clearly abnormal and needs explanation?" (with the knowledge that for a patient with risk factors for liver disease we will not be relying on liver transaminases as a screening test).

    Here's the cumulative frequency graph for ALT for all specimens from primary care for men and women. I have ignored all results above 100 - which is about 10% of all results. This moves into results that are much more likely to come from patients with pathology. So this graph then represents a reasonably "normal" distribution of ALT in our population, with the caveat that obesity rates run at about 25%. 


    Looking at different cut off values, we can estimate the percentage of a normal population that would be above this value.

    ALT cut off = 35  leads to 13% of women and 18% of men with abnormal result
                        = 40                11% of women and 14% of men
                        = 50                  7% of women and 10% of men
                        = 60                  4% of women and  6% of men
                        = 80                  2% of women and  2% of men

    What is the uncertainty of measurement? We can look at people with relatively normal ALTs (12-50) and see what the value was if was repeated on the same day. This can be plotted as a cumulative frequency graph and we can see that we can have about 90% certainty that a result will lie somewhere between +/- 20% of the initial value.
    This fits well with the published data (Westgard) which suggests a CVi of 20.

    There are some implications of this for clinical interpretation and quality control.

    1. We probably shouldn't worry about ALTs until they get to about 80.
    2. We need to make sure that our laboratory quality control, which focusses purely on technical precision and accuracy, reflects this much larger total uncertainty in the result. Again the Westgard site is helpful, suggesting we need to make sure that precision is within 9.7%; inaccuracy within 11.5%; and total error within 27%. 

    We do not need to be that accurate in measuring ALT - it just does not have the clinical imperative that we might see for things such as potassium and creatinine. I want clinical results that reflect this.

    As an aside, here's a graph of ALT distributions across the years, and it is easy to spot the analyser change in 2018. I do not understand why this problem cannot be sorted out by standardisation to common reference material; or just through EQA schemes. This just creates confusion and seems both overly scientific in a failure to accept clinical reality; and under-scientific in that it clearly does not relate the measurement to a stable gold standard. 


    Tuesday, 28 November 2017

    CRP - the most overused and overrated test of all time?

    Most days it feels like half the calls I get as a consultant microbiologist are from junior doctors who are worried because a patient's CRP has gone up. My cure for that problem is to tell them to stop measuring it. CRP used to be a test that was used carefully. It is now used as part of routine monitoring. There are calls to use it as a rule out test for sepsis in primary care. So what is the performance of this test for detecting significant infection in the real world?

    We have looked at the ability of CRP to predict bacteraemia, which is probably a reasonable proxy measure of sepsis. We looked back at all blood cultures sent to our lab between Jan 2011 and August 2017. This identified 36396 sets of cultures, of which 32703 were negative, 1210 grew a likely contaminant, 1800 grew a likely pathogen and 683 grew an organism isolated in a duplicate set. We then linked this data with concurrent laboratory requests for a CRP. The number of specimens with a CRP measured within 7 days were : 29403 (90%) for negative; 1063 (88%) for contaminant; and 1699 (94%) for an isolated pathogen.

    Figure 1 shows the day of the peak CRP measured in the episode. We can see that in episodes with proven infection, there is a lag to peak CRP.

    fig.1 Day of peak CRP

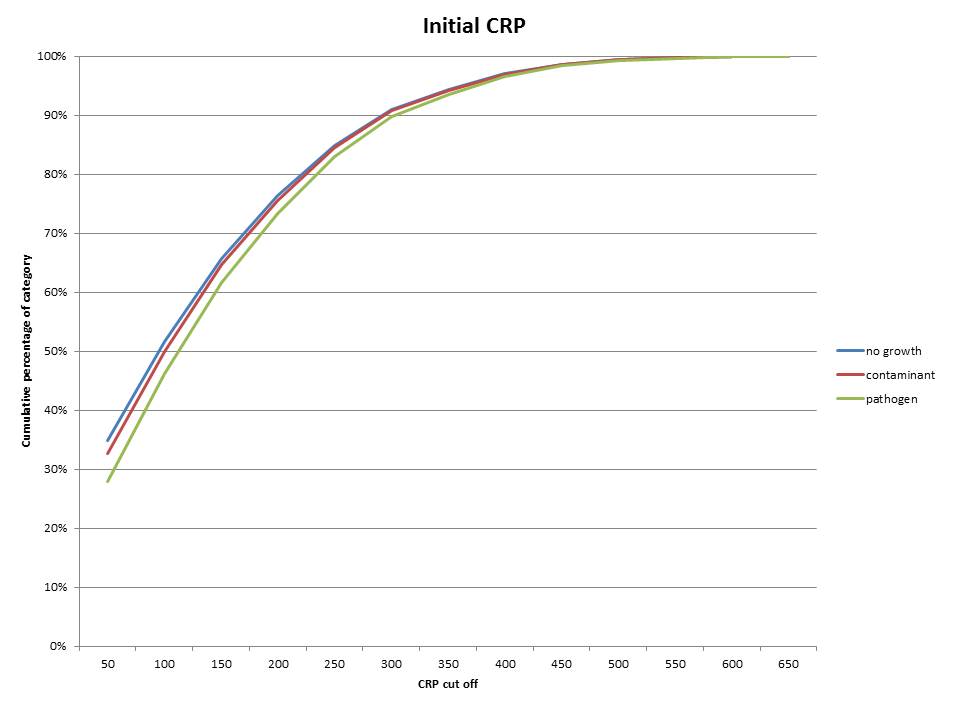
    We then looked at how the initial CRP predicts bacteraemia. Figure 2 shows the cumulative percentage of episodes in each category at increasing CRP cut-offs (in other words, the number of episodes that would be missed for a particular cut-off CRP value). We can see that 30% of cases of significant bacteraemia have a CRP below 50 on presentation, and over 50% have a CRP below 200.

    fig 2

    The small difference in the curves for the three categories also suggests that initial CRP is not good at discriminating between infection and not infection. We can see this if we plot a receiver-operator curve (fig 3). In a ROC, a test with no value shows a straight line, whereas a good test has a hyperbolic distribution. The initial CRP looks very straight on the ROC. You can draw your own conclusions about the performance of the initial CRP in predicting bacteraemia.


    fig 3. ROC for initial CRP in predicting bacteraemia

    We then repeated the analysis for the peak CRP measured in the week after the blood culture draw. (fig 4 and 5). So it performs a bit better than the initial CRP, but not a lot.
    fig 4


    fig 5. fig 3. ROC for peak CRP in predicting bacteraemia

    So this is my main conclusion :

    It is not possible to find a cut-off value for CRP that tells you anything meaningful about the probability of bacteraemia

    We can probably also conclude that there is often a delay between onset of serious infection and rise in CRP. So CRP is really bad at telling us what is going on in an acute setting.

    Why are people pushing CRP then? I guess when it was carefully performed in selected cases when it was first brought in as a test, it was quite useful. We can see from our data that there is some signal there, but it's drowned out by noise.

    I also suspect that in most cases a CRP is telling us absolutely nothing, but we are using the result to justify our decision making. When it suits us and it confirms our prejudice. Of course, the problems come when there is a mismatch between these two things. People cope with this dissonance in many ways. The most annoying of which is to phone the microbiologist. The most dangerous of which is to make an inaccurate diagnosis.


    Monday, 23 October 2017

    Antibiotic resistance is a distraction in community onset sepsis


    1. Sepsis usually presents rapidly. Most patients with sepsis know that they are seriously unwell, and go straight to the ED, without presenting to primary care in the preceding days. Sometimes this involves a telephone triage by 111. Occasionally there is a prior review by a primary care doctor. This process appears to work well.

    2. There are occasional cases which present more insidiously to primary care in the days preceding onset of sepsis.

    These are harder to recognise and do not fall into patterns that are easy to define. Here, clinical judgement is crucial and should be valued and supported. Protocols for recognition of sepsis do not seem to translate easily into primary care, and we should be wary about adopting guidance in which secondary care based assessment protocols have been adapted according to expert opinion with no evidence base. Local practitioners felt that following rigid protocols in primary care could lead to overdiagnosis of sepsis, particularly in self-limiting viral illness. However, they also voiced concerns around medicolegal issues that may result from not following these protocols. Our cases also show that sepsis presents in ways that may be missed by secondary care protocols. Our cases suggest some features of severe infection that practitioners should be aware of when assessing patients in primary care, such as change in mental state and history of rigors. Current body temperature seems unhelpful. These observations fit well with recommendations in some scoring systems (eg. qSOFA). There may be a need for better rapid diagnostics to support clinical decisions. However, we noted that 19 of the 50 patients had a CRP below 100 on admission to the ED. We also saw that white blood cell counts were frequently normal. We did not examine the potential benefit of other inflammatory markers (eg, procalcitonin). There may be constellations of common tests that add value to the diagnostic and therapeutic processes. For instance, 12 patients had evidence of acute kidney injury on admission. This is likely to be important in determining severity and prognosis.

    3. We need to recognise the importance of good quality care for chronic disease. 

    eg. Diabetes, ulcers, catheters. Good management of these conditions is likely to reduce the incidence of downstream problems, including sepsis. We noted that care of these conditions is becoming fragmented, falling between different agencies (eg. doctors, community nursing, practice nursing, specialist nursing, care homes) and we often saw a lack of joined up care planning. In addition, despite the high prevalence of these problems, there is often a lack of evidence on which to base decisions (for example, prevention and management of catheter blocking). We may also need to consider more innovative models of care delivery for these patients. For instance, “leg clubs” have been set up for patients with chronic leg ulcers to encourage mutual support . Such psychosocial approaches may be more effective in persuading patients who struggle with compression to persevere with a treatment that is effective but uncomfortable.

    4. There are a group of recurrent /chronic infections for which we lack good guidance on management.

    Eg. UTI in men / recurrent UTI / cellulitis in ulcers / vaccine preventable pneumococcal infection in chronic lung disease. We need to develop new approaches to these. Some simple key primary care messages may help, for instance, around appropriateness of patient directed self-start antibiotics in recurrent UTI 7 and clearer guidance on when patients should be referred for investigation of underlying problems, such as urinary retention. A further problem in these cases is loss of continuity of care. When episodes of infection are relatively infrequent, we saw that each episode tended to be treated in isolation. A loss of continuity of care has been identified as a factor leading to hospital admission. We need to find ways to compensate for these changes to healthcare delivery, and, for instance, laboratories may be well placed to identify and alert carers to emerging patterns.

    5. There is an ongoing need to ensure that microbiological diagnostics are aligned to clinical need.

    Currently, diagnostics are significantly compromised by the poor quality of specimens that are received in the laboratory. The importance of this is illustrated by a case in our series of Group B streptococcal infection from an infected ulcer. Laboratory standard procedures target S. aureus and Groups A, C and G haemolytic streptococci from superficial wound swabs. It is hard to determine what is pathogenic in these specimens, which are often of low quality and lack clinical details, and this can lead to overtreatment of colonising flora. Improved swab methodologies (eg. debridement prior to sampling) may enable better discrimination between pathogens and colonising organisms.

    6. Antibiotic resistance (in this series at least) was a minor reason for development of sepsis. 

    We saw four cases of potentially avoidable admission in which the organisms were resistant to empirical (guideline) antibiotics. However, in two cases, it is extremely doubtful that antibiotics in the community could have altered the natural history, and in all cases it was hard to imagine alternative and reasonable empirical options in the absence of specific sensitivity data. We need to consider how diagnostics can support early detection of important resistance in primary care.